Posted on January 11, 2024

By Alena Siddiqui
For more information on this topic or kids count data, contact Alena at asiddiqui@acnj.org

On January 10, 2024, the Annie E. Casey Foundation released its 2024 Race for Results policy report. This report comes ten years after the first Race for Results report in 2014, and through a variety of indicators illustrates the well-being of young people living in the United States. The data is broken down by race, ethnicity, and immigrant family status, which illustrates a more detailed view of the diversity in the United States.
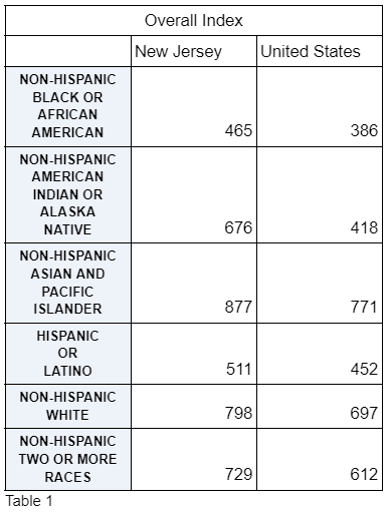
The policy report provides an Overall Index which gives a combined score out of 1,000 possible index points for each racial/ethnic group. New Jersey is doing quite well for each racial/ethnic group compared to the United States as a whole (Table 1). Non-Hispanic Asian and Pacific Islander young people living in New Jersey have the highest overall index in the country. New Jersey’s young non-Hispanic American Indian or Alaska Native population has the second-highest overall index in the country. Despite New Jersey’s children faring better than many across the nation, it is crucial for policymakers and the community at large to compare the state’s children to each other to understand where help is needed and then create actionable change. The indicators chosen for this report are reflective of different facets of a child’s life broken into four categories: early childhood, education and early work experiences, family resources, and neighborhood context. Over the next few weeks, ACNJ will be spotlighting some data points from each of these categories.

Family Resources
Based on data collected during 2017-2021, about 71% of children in New Jersey are living at or above 200% of the poverty level, an increase from 68% in 2012-2016. For a family of four, 200% of the poverty level is approximately $55,000. When that data is broken down by race/ethnicity, we see disparities. For instance, 87% of non-Hispanic Asian and Pacific Islander children and 82% of non-Hispanic White children were living at or above 200% of the poverty level. Also, of the children who are Hispanic/Latino or of non-Hispanic Black or African American background, only 5 of every 10 are living at or above 200% of the poverty level. While this is an increase from 2012-2016, as non-Hispanic Black or African American children were at 48% and Hispanic/Latino children were at 45%, the statistics show that equitable work needs to be done to address these racial/ethnic disparities. When categorized by family type, 74% of children in U.S. born families are living at or above 200% of the poverty level compared to 66% of children in immigrant families.
Neighborhood Context
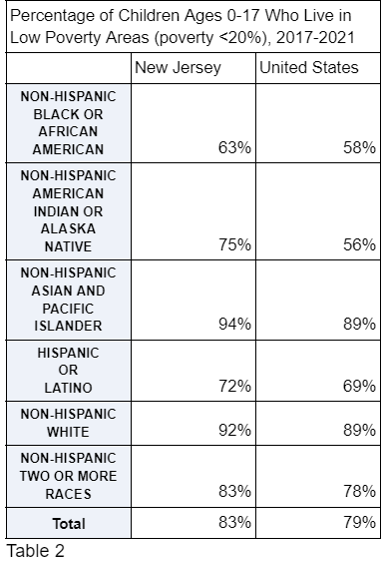
Another interesting indicator related to poverty is the percentage of children living in low-poverty areas. Low-poverty areas are those areas where less than 20% of families have incomes below the poverty level. The reason the Annie E. Casey Foundation included this indicator is because past policies, like redlining, have led to families of color more often living in high-poverty neighborhoods. In 2017-2021, 8 of every 10 children in New Jersey were living in low-poverty areas (Table 2). This table shows the same trend where children living in New Jersey, while doing better than their counterparts nationwide, still need help to escape systemic poverty. Also, 85% of children in U.S. born families and 80% of children in immigrant families living in the Garden State are in low-poverty areas compared to nationally, where the numbers are 80% and 76% respectively.

The 2024 Race for Results report has many other interesting indicators which show the well-being of our children. You can learn more about the report and access it here.

